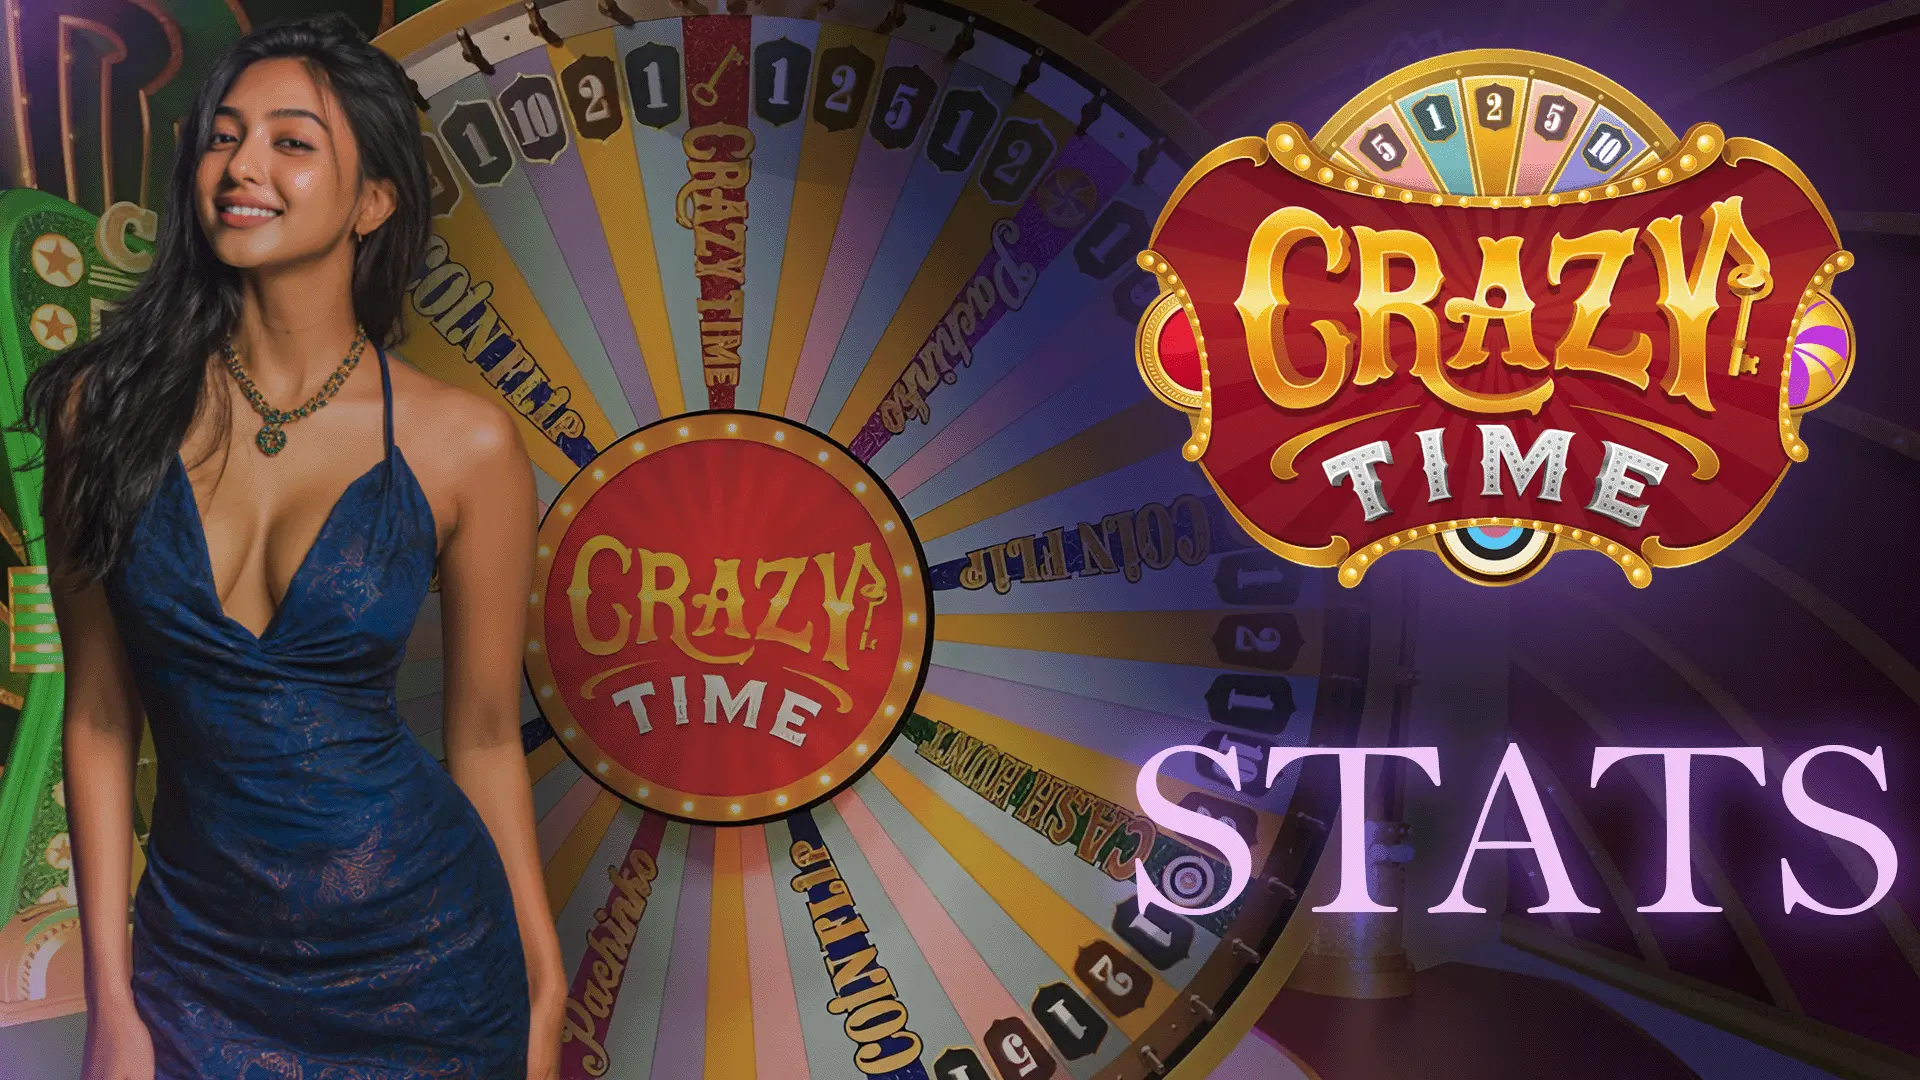
Crazy Time Live Statistics 📊
Real-time data from the official Crazy Time API. Track results, analyze frequencies, monitor hot and cold segments. Updated automatically every 30 seconds.
📈 Live Dashboard
Current session statistics
Latest Result
🔥 Hot Segments
Above expected frequency
❄️ Cold Segments
Below expected frequency
📊 Frequency Analysis
Actual vs Expected (last 100 spins)
| Segment | Expected | Actual | Deviation | Status |
|---|---|---|---|---|
| 1️⃣ Number 1 | 38.89% | -- | -- | -- |
| 2️⃣ Number 2 | 24.07% | -- | -- | -- |
| 5️⃣ Number 5 | 12.96% | -- | -- | -- |
| 🔟 Number 10 | 7.41% | -- | -- | -- |
| 🪙 Coin Flip | 7.41% | -- | -- | -- |
| 🎯 Cash Hunt | 3.70% | -- | -- | -- |
| 🎰 Pachinko | 3.70% | -- | -- | -- |
| 🌈 Crazy Time | 1.85% | -- | -- | -- |
Visual Frequency Comparison
🕐 Results History
Last 50 spins
Detailed History
| # | Result | Multiplier | Top Slot | Time |
|---|---|---|---|---|
| Loading... | ||||
🎰 Bonus Tracker
Bonus game statistics
Coin Flip
Expected: 7.41%Cash Hunt
Expected: 3.70%Pachinko
Expected: 3.70%Crazy Time
Expected: 1.85%📚 Understanding These Statistics
What the data actually means
What "Hot" and "Cold" Really Mean
When we label a segment as "hot" or "cold," we're simply noting that it has appeared more or less frequently than its mathematical expectation in recent spins. This is completely normal statistical variance — it happens naturally in any random system and doesn't indicate any predictive pattern.
Consider flipping a fair coin: sometimes you'll get 7 heads in 10 flips, sometimes only 3. Neither outcome means the coin is "due" to balance out. Each flip remains 50/50 regardless of history. Crazy Time works the same way — each spin is independent, and the wheel has no memory of previous results.
We display this data because many players find it interesting, and it can help illustrate how variance manifests in real gameplay. However, using hot/cold data to make betting decisions is mathematically futile. A segment that's been "cold" for 50 spins has the exact same probability on spin 51 as it always does.
What Statistics CAN Tell You
- Historical record of what happened
- How variance looks in real data
- Typical bonus frequencies to expect
- Understanding normal deviation ranges
What Statistics CAN'T Tell You
- What will happen on the next spin
- Which segment is "due" to hit
- When the next bonus will trigger
- Any pattern to exploit for profit
The Gambler's Fallacy
The gambler's fallacy is the mistaken belief that past results influence future outcomes in independent events. Examples include:
- "Crazy Time hasn't hit in 100 spins, so it's due!" — False. Each spin has 1.85% probability regardless of history.
- "Number 1 has been hot, so I'll ride the streak!" — Fallacy. The 38.89% probability doesn't change based on recent results.
- "This pattern always leads to Pachinko!" — Impossible. The wheel has no memory; patterns are coincidental.
Professional gamblers and mathematicians universally agree: in games of pure chance like Crazy Time, past results provide zero predictive information about future outcomes. Use statistics for entertainment and education, not as a betting guide.
🔌 Data Source & Methodology
Where our statistics come from
Our statistics are sourced from the official Crazy Time game API via RapidAPI. This is the same data feed that casinos and other tracking services use. The data reflects actual game results from Evolution Gaming's live Crazy Time wheel.
Technical Details
- Data Source: RapidAPI Crazy Time endpoint
- Update Frequency: Every 30 seconds (automatic)
- History Depth: Last 50-100 spins displayed
- Calculation Method: Standard frequency analysis (count / total × 100)
- Hot/Cold Threshold: ±2% deviation from expected
We do not manipulate, filter, or selectively display results. What you see is a direct representation of actual game outcomes. However, remember that even authentic data cannot predict future results due to the independent nature of each spin.
❓ Statistics FAQ
No. Each Crazy Time spin is completely independent. The wheel has no memory, and past results have zero influence on future outcomes. Statistics show what happened, not what will happen. Anyone claiming otherwise is either misinformed or lying.
Many players find it interesting, and it helps illustrate how variance works in real data. Seeing actual deviation from expected values is educational — it shows that short-term results can differ significantly from long-term probabilities, which is important to understand for responsible gambling.
The data comes from the official Crazy Time API used by casinos and tracking services. It reflects actual game results with typical delays of a few seconds. We don't manipulate or filter the data — what you see is what actually happened on the live wheel.
No. This is the gambler's fallacy. A segment with 2% probability has exactly 2% probability on every spin, regardless of whether it hit or missed in previous spins. The wheel doesn't "remember" past results or try to balance them out. Extended absence is unusual but doesn't change future odds.
This is normal variance. Expected frequencies only manifest accurately over very large sample sizes (thousands of spins). In 50-100 spins, significant deviation is common and expected. A segment with 10% expected frequency might show 5% or 15% in any given 100-spin sample — that's not unusual or indicative of anything wrong.
No. Crazy Time uses certified Random Number Generator (RNG) technology audited by independent testing labs. Evolution Gaming is licensed and regulated; manipulating results would be illegal and would destroy their business. The house edge (3.92%) provides the casino's profit without any manipulation needed.
Ready to Play?
Remember: statistics are for entertainment. Play responsibly at certified casinos.
18+ | Past results ≠ future outcomes | House edge 3.92% | Help: 01779-554391